I'm very proud to present a collaboration with Vladan Joler & Gordan Savicic. A map of the anthropogenic ecosystem assembled for the Northern Bald Ibis, with the goal of enabling wilderness in the Anthropocene. Check out the audio tours! Feedback welcome.
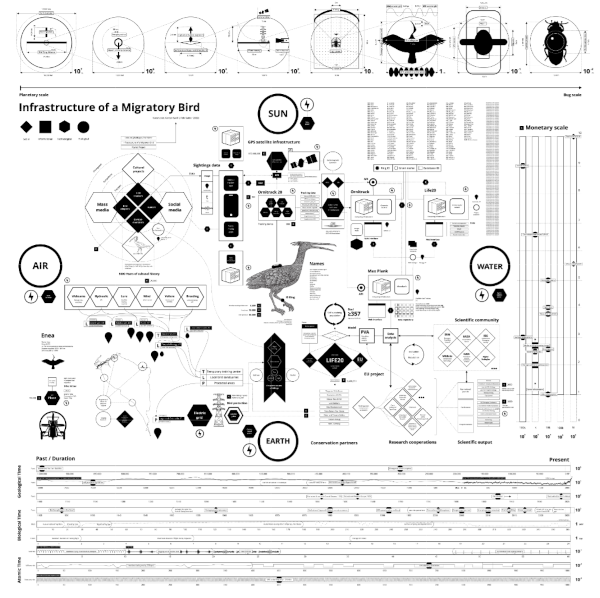
This diagram consists of a relational graph and three scales.
The graph shows relationships between social, technological, informational, and ecological elements which make up the anthropogenic ecosystem in which the bird is becoming wild again. It is divided into four quadrants.
Top left are elements shaping the public’s understanding of and relationship to the bird.
The top right comprises elements generating real-time data flows through which the birds are monitored and the rewilding project makes sense of itself.
Bottom left are discontiguous locales connected and adapted to make room for the bird.
Bottom right are institutional networks that make up the project, provide funding, and negotiate scientific value.
The scales show the spacial, monetary, and temporal dimensions of many of the elements that make up the relational graph. Thus, the scales provide another way of understanding these elements.